


When you run an AI agent in production, you need to know what it's doing. Which model did it call? How many tokens did it use? How long did the inference take? Did a tool call fail silently? Without tracing, your agent is a black box.
The need for visibility has never been more urgent. In early 2026, security audits of the ClawHub skills marketplace uncovered 341 trojanized skill packages that silently installed credential stealers, while a broader scan by Snyk found that 7% of all published skills exposed secrets in plaintext. These attacks succeed precisely because operators have no visibility into what their agents are doing -- a malicious skill making unexpected network calls or exfiltrating data looks the same as a legitimate one when you have no tracing. Observability turns that blind spot into an auditable trail of every tool call, every model interaction, and every piece of data flowing through your agent.
Problems like these are easily solved with an eval that checks for api keys in traces, giving you a notification when they occur. But for that, you need traceability.
This post covers two ways to get tracing working with OpenClaw:
Full OTEL setup -- send traces from OpenClaw to Orq.ai (or any OTEL-compatible backend)
Use the Orq AI Router -- get automatic tracing on every LLM call with zero OTEL configuration
The repos
Before diving into setup, it helps to understand how the pieces fit together. There are three repos involved:
Repo | What it is |
|---|---|
Our fork of OpenClaw, with full OTEL tracing and the Orq provider bundled in | |
The Orq provider as a standalone plugin, installable on upstream OpenClaw |
The fork (orq-ai/openclaw) is the easiest starting point if you want everything working out of the box — it includes the OTEL diagnostics plugin and the Orq provider as a submodule, so no extra install steps are needed. If you're already running upstream OpenClaw and don't want to switch forks, you can install just the provider plugin from orq-ai/openclaw-orq-provider.
Why trace your agent?
Running an agentic AI system means many things happen behind the scenes: model inference calls, tool executions, retries, token usage, and cost accumulation. Tracing lets you:
Debug failures -- see exactly which step in a multi-turn conversation went wrong
Monitor costs -- track token usage and cost per model call
Optimize latency -- identify slow inference calls or tool executions
Audit behavior -- review what your agent said, which tools it called, and why
Set up automations -- trigger alerts, evaluations, or dataset collection based on trace data
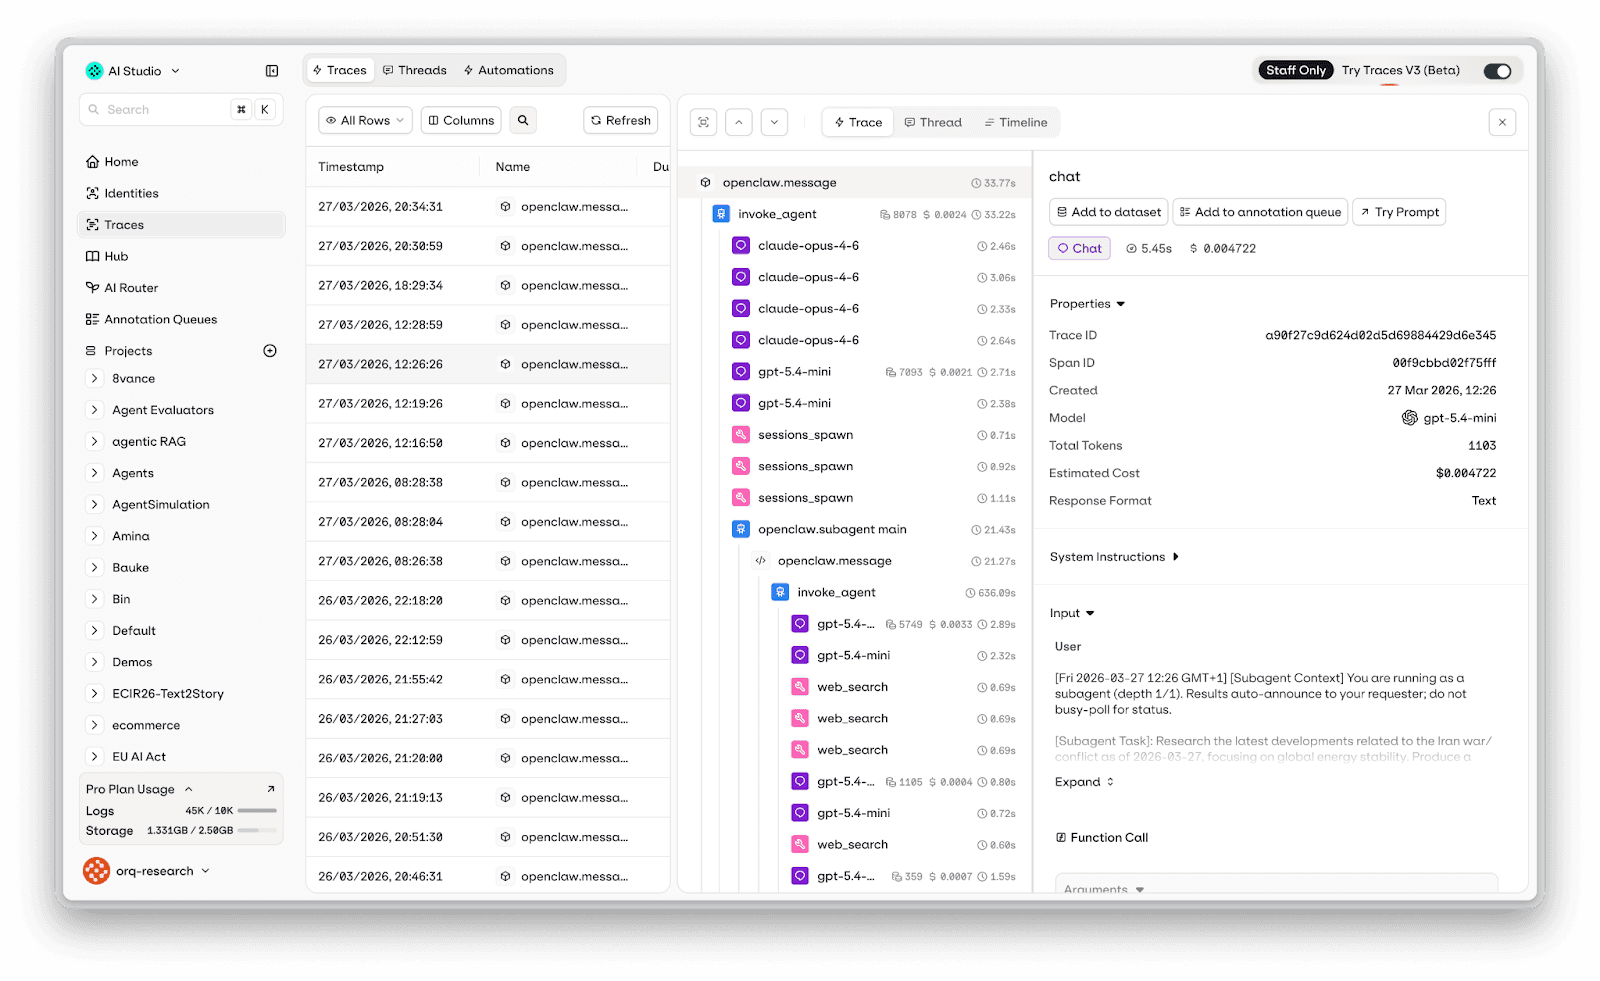
Showcase of OTel traces for openclaw showing tool calls and subagents
Option 1: Full OTEL tracing (Recommended)
The orq-ai/openclaw fork ships with a diagnostics-otel plugin that exports traces, metrics, and logs using the OpenTelemetry Protocol (OTLP). It follows the GenAI semantic conventions, so traces work out-of-the-box with GenAI-aware backends like Orq.ai, Datadog, Grafana, Langfuse, and Arize.
Installing the fork
What gets traced
The plugin instruments the full lifecycle of an agent interaction, not just model calls. It creates a span hierarchy that includes:
Each span includes attributes like:
The model and provider used.
Input and output tokens
Stop reason
Tool names, call IDs, and execution duration
Setup: Send traces to Orq.ai
Step 1: Enable the plugin
openclaw plugins enable diagnostics-otel
Step 2: Configure the OTEL exporter in ~/.openclaw/openclaw.json:
Alternatively, you can set the endpoint and credentials via environment variables instead of hardcoding them in the config file (config file settings take precedence). These override just the OTEL connection settings — diagnostics.enabled: true and the plugin entry are still required in the config file:
Note: The OTEL endpoint expects the API key as a Bearer token in the Authorization header ("Bearer orq_..."), while the Orq Router expects it in the apiKey field directly ("orq_..."). Both use the same Orq API key.
That's it. Restart your OpenClaw gateway and traces will start appearing in the Orq.ai Traces dashboard.
The plugin automatically appends /v1/traces, /v1/metrics, and /v1/logs to the endpoint.
Key config options:
Option | Default | Description |
|---|---|---|
|
| Master switch for OTEL export |
| — | OTLP collector URL |
|
| Transport protocol (only |
|
| Export trace spans |
|
| Export metrics (token usage, cost, latency) |
|
| Export structured logs via OTLP |
|
| Trace sampling rate (0.0–1.0) |
| SDK default | How often to flush metrics/logs (ms) |
|
| Include LLM message content in spans |
|
| Service name in resource attributes |
Optional: capture message content
By default, message content is not included in traces (for privacy). You can enable it globally or per-field. Add captureContent inside the existing diagnostics.otel block (alongside endpoint, headers, etc.):
Set "captureContent": true to enable all fields at once.
Warning: Enabling content capture records all prompts and model responses in your traces. Only enable this in environments where you're comfortable storing that data.
Debugging OTEL export
If traces aren't showing up, enable debug logging:
You'll see output like:
To dump all spans to a local file for inspection:
Option 2: Use the Orq.ai AI Router (simpler alternative)
If you don't want to set up OTEL infrastructure, there's a much simpler path: route your LLM calls through the Orq AI Router. When you do this, Orq.ai automatically traces every model call -- no OTEL configuration needed.
The Orq Router is an OpenAI-compatible proxy that sits between OpenClaw and your model providers. Every request that flows through it is automatically logged, traced, and visible in the Orq.ai dashboard.
Setup: Install the Orq provider plugin
Option A: Use the orq-ai fork (recommended)
The fork bundles the Orq provider out of the box. Run onboarding with your Orq API key (get one at my.orq.ai):
Option B: Install on upstream OpenClaw
If you're running vanilla OpenClaw, install the provider as a standalone plugin from orq-ai/openclaw-orq-provider:
Then run openclaw configure to set up the models and select the one you want to use.
Restart your gateway and every LLM call will now flow through the Orq Router. You can view traces in the Orq.ai Router Traces dashboard -- filter by model, provider, status, cost, or duration.
Available models
The Orq provider gives you access to 45+ models across multiple providers through a single API key:
Provider | Models |
|---|---|
Anthropic | Claude Opus 4.5, Sonnet 4.5, Haiku 4.5 |
OpenAI | GPT-5, GPT-5 Mini/Nano, GPT-5.2, GPT-5.4, GPT-5.4 Mini/Nano/Pro |
Gemini 2.5 Pro/Flash, 3 Pro/Flash Preview, 3.1 Pro/Flash Lite Preview | |
Groq | Llama 3.x/4.x, Kimi K2, Qwen 3 |
Cerebras | GPT OSS 120B, Llama 3.x, Qwen 3 |
DeepSeek | DeepSeek Chat, DeepSeek Reasoner |
MoonshotAI | Kimi K2.5 |
Alibaba | Qwen 3.5 Plus, Qwen 3.5 397B |
Z.AI | GLM-5, GLM-4.7 Flash (free) |
MiniMax | MiniMax M2.7 |
The default model is orq/openai/gpt-5.4-mini.
When to use which approach
OTEL Plugin | Orq Router | |
|---|---|---|
Setup complexity | Moderate (config + endpoint) | Minimal (just add provider) |
What's traced | Model calls, tool executions, subagents, hooks, cron jobs | Model calls (inference only) |
Works with any backend | Yes (any OTLP-compatible collector) | Orq.ai only |
Traces tool calls | Yes | No |
Traces agent turns | Yes | No |
Custom metrics | Yes (token usage, cost, latency histograms) | Built into Orq dashboard |
Requires OTEL knowledge | Some | None |
TL;DR: Use the Orq Router if you just want to see your LLM calls traced with minimal setup. Use the OTEL plugin if you want full agent-level observability with tool execution spans, subagent lifecycles, custom metrics, and the flexibility to send traces to any backend.
Combining both
You can use both approaches together. Route your LLM calls through the Orq Router and enable the OTEL plugin to send agent-level traces to Orq.ai. This gives you the best of both worlds: automatic router-level traces for every model call, plus detailed agent-level spans for tool executions and message flow.
Conclusion
If you're just getting started with OpenClaw, it's tempting to skip tracing -- everything looks fine in your terminal. But the moment you connect a channel like Telegram or WhatsApp, you lose that visibility. Skills fail silently, costs creep up, and you have no way to tell.
We'd recommend adding tracing early. Start with the Orq Router; just add it as a provider in your openclaw.json (or use the orq-ai fork which bundles it) and you'll immediately see every LLM call in the Orq.ai dashboard. No OTEL setup needed. Once your agent grows more complex with sub-agents, tools, and multi-turn conversations, add the OTEL plugin for full agent-level tracing. Both live in the same config file and work side by side.
Further reading
orq-ai/openclaw fork -- OpenClaw with OTEL and Orq provider built in
orq-ai/openclaw-orq-provider -- Orq provider as a standalone plugin

